Fitness Studio KPI Dashboard — SQL Integrated
End-to-end analytics case study: SQL star schema + Power BI model with DAX. Tracks Total Revenue, Revenue per Client, Active Clients, Total Bookings, and Avg Class Occupancy with Top Trainers/Classes and Monthly trends (2024–2025).
Dashboard focuses on revenue, bookings and class utilisation — built on a clean SQL star schema with robust DAX.
Decisions this dashboard enables
- Strategic: focus time and capacity on the studios, classes, and trainers that create the most value.
- Commercial: tighten discounts, adjust pricing, and rebalance class mix to protect margin.
- Operational: track active clients, bookings, and occupancy; flag locations drifting from plan.
- Diagnostic: slice by Studio, Class, and Trainer to explain variances and find opportunities.
Power BI — Core DAX Measures
Total Revenue = SUM(FactBookings[Revenue])

Revenue per Client = DIVIDE([Total Revenue], DISTINCTCOUNT(DimClient[ClientID]))

Active Clients = DISTINCTCOUNT(FactBookings[ClientID])

Total Bookings = COUNTROWS(FactBookings)

Avg Class Occupancy =
  AVERAGEX(
    FactBookings,
    DIVIDE(FactBookings[Attendees], RELATED(DimClass[Capacity]), 0)
  )
How to use: scan KPIs → filter by Date/Studio/Class → drill into Trainers/Classes → compare month-over-month.
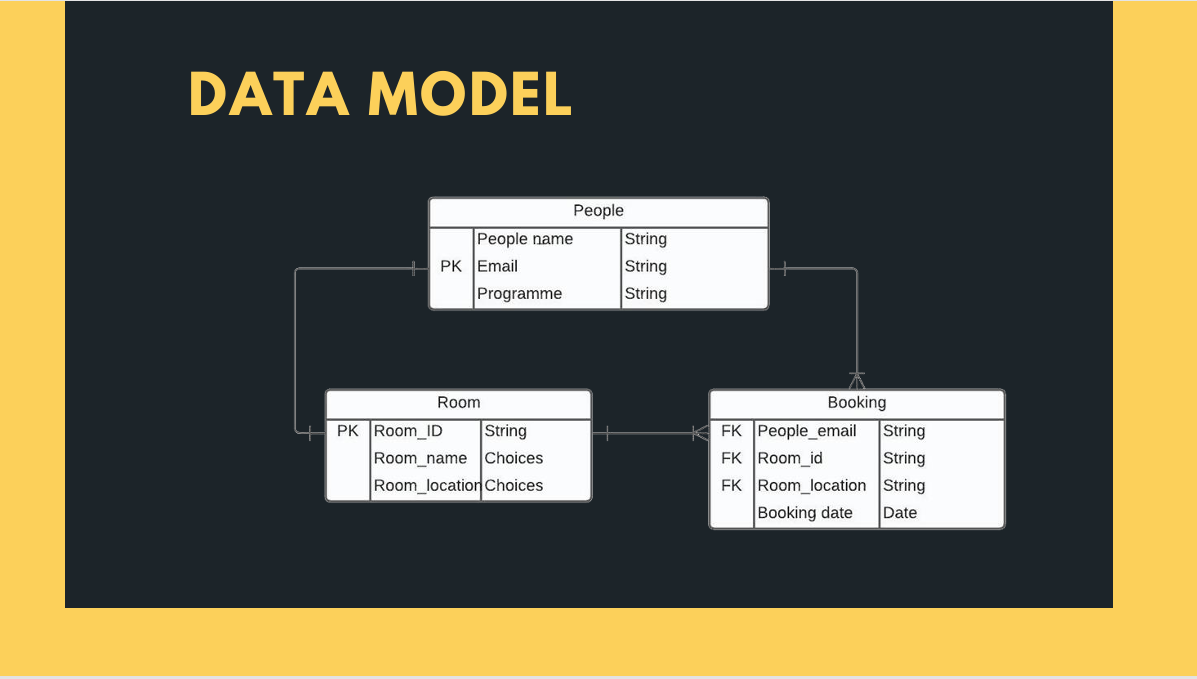
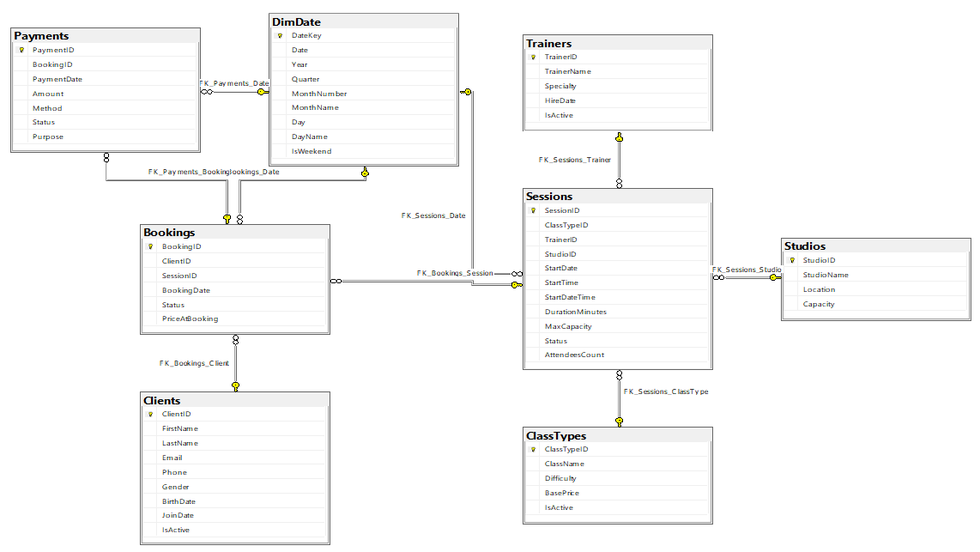
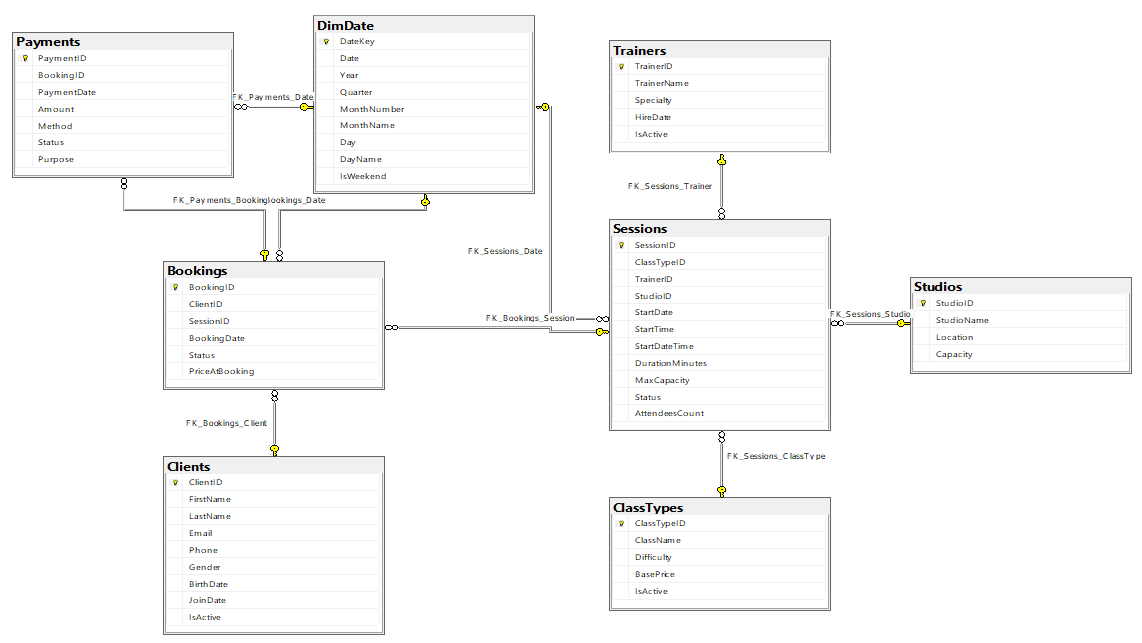
SQL/Data Model (star schema): FactBookings with lookups to DimDate, DimClient, DimTrainer, DimClass and DimStudio. 1-to-many relationships (single direction). DimDate marked as the Date table.
Technical Appendix — SQL
All data is synthetic/anonymised for portfolio purposes.
Deploy database — 01_deploy_studiomanagement.sql
/* excerpt */
CREATE DATABASE StudioManagementDB_New;
GO

USE StudioManagementDB_New;
GO
Power BI views (star-friendly) — 02_bi_views_star.sql
/* excerpt */
CREATE VIEW dbo.DimClient AS
SELECT ClientID, Gender, JoinDate,
       CASE WHEN IsActive=1 THEN 'Active' ELSE 'Inactive' END AS [Status]
FROM dbo.Clients;

CREATE VIEW dbo.FactBookings AS
SELECT b.BookingID, b.ClientID, s.ClassTypeID AS ClassID, s.StudioID, s.TrainerID,
       (YEAR(b.BookingDate)*10000)+(MONTH(b.BookingDate)*100)+DAY(b.BookingDate) AS BookingDateKey,
       b.PriceAtBooking AS Price,
       ISNULL((SELECT SUM(p.Amount)
               FROM dbo.Payments p
               WHERE p.BookingID=b.BookingID
                 AND (p.Status IN ('Paid','Completed') OR p.Status IS NULL)),0.00) AS Revenue,
       CASE WHEN b.Status='Completed' THEN 1 ELSE 0 END AS AttendanceFlag
FROM dbo.Bookings b
JOIN dbo.Sessions s ON s.SessionID=b.SessionID;
Data prep / business rules — DataPrep_Add_Cancel_NoShow_2024.sql
/* excerpt */
-- Resets 2024 rows to idempotent baseline, then samples
-- ~5% as Cancelled and ~2% as No-Show (on the remainder).
UPDATE b
SET    b.Status='Cancelled'
FROM   dbo.Bookings AS b
JOIN   #pick_cancel c ON c.BookingID=b.BookingID;
Daily KPI view — v_KPI_Daily.sql
/* excerpt */
CREATE OR ALTER VIEW dbo.v_KPI_Daily AS
WITH d AS ( SELECT [Date],[Year],MonthNumber,MonthName FROM dbo.DimDate ) ...
SELECT d.[Date], d.[Year], d.MonthNumber, d.MonthName,
       CAST(COALESCE(pb.TotalRevenue,0) AS DECIMAL(18,2)) AS TotalRevenue,
       COALESCE(bb.TotalBookings,0) AS TotalBookings,
       CAST(1.0 * COALESCE(sb.TotalAttendees,0) / NULLIF(COALESCE(sb.TotalCapacity,0),0) AS DECIMAL(8,4)) AS UtilizationRate
FROM d
LEFT JOIN PayBase pb  ON pb.[Date]=d.[Date]
LEFT JOIN BookBase bb ON bb.[Date]=d.[Date]
LEFT JOIN SessBase sb ON sb.[Date]=d.[Date];
 Read 2-Page Executive Brief (PDF)